
How to Create Your First No-Code Dataflow
Data can be daunting at first, but no-code dataflows have changed the game. No-code dataflows enable you to conceptualize data analysis and connections in a straightforward and radically simple way.
Learn what a dataflow is and what to expect when creating your first no-code dataflow.
What is a Dataflow?
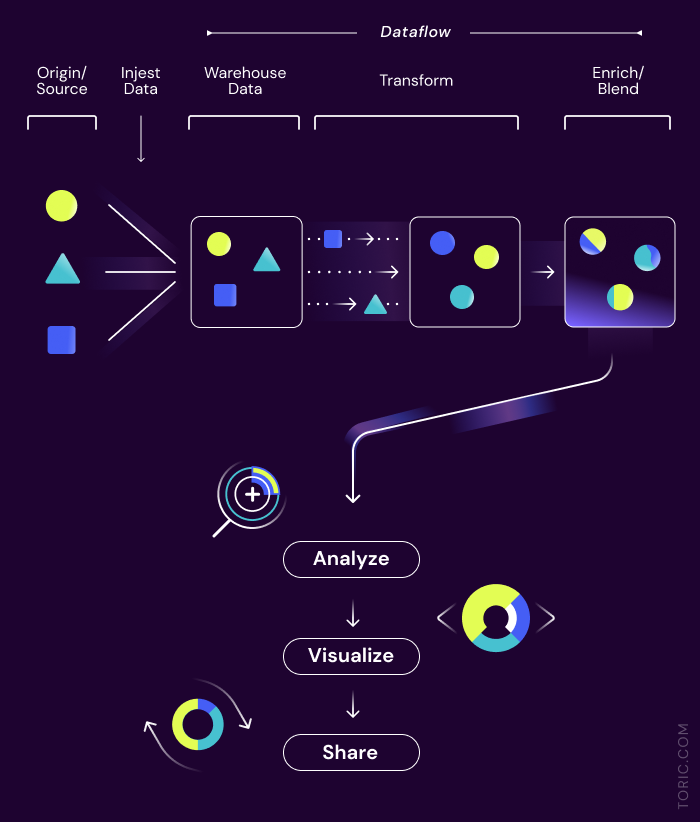
A dataflow (or data flow) is the way data moves through a program or system. This can also include models or diagrams that map the movement of this data.
How Toric Uses Dataflows
Toric dataflows take the concept of dataflow charts and enable a completely interactive birds-eye view of transforming data and discovering insights. As you explore your data in Toric, keep in mind that this is a single data pipeline solution- you do not need to use multiple programs to create a data pipeline like you would in a conventional data pipeline- instead you can load, store, transform, explore your data all in the dataflow workspace.
Simultaneously, you can build data apps or smart reports as you build your dataflow and explore your data. Finally, you can share synced data apps from Toric and even embed them wherever your team needs to view the report.
How to Create Your First Dataflow in Toric
1 - Start with a Pre-Built Data App
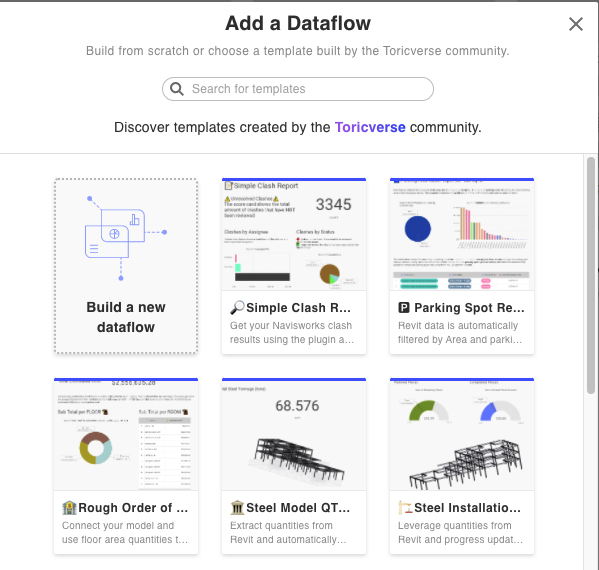
You don't have to start from scratch - explore our library of pre-built data apps.
Keep in mind - you can build your own reusable data app library. A major advantage of Toric is that you can build and reuse these apps by swapping out the data.

2- Load in your own data or use our sample data to start exploring
Use our sample Toricverse data in the data source panel to build a dataflow if you don't want to use a pre-built data app but aren't ready to load in your own data.
3- Use the available navigation
Navigate the data in multiple ways. View the data in the overview panel, use your dataflow preview. Even navigate all the data in your dataflow from your app. Everything is connected.
4- Take advantage of the resources available
Stuck and looking for more help? Our team is always available to help you. Navigate our support site, submit a ticket in Toric, or ask a question within our support. Enterprise customers get added benefits such as supporting pre-built data apps for their use case and additional support for plugin and integration requests.
Main Elements of a No-Code Dataflow
To help you navigate no-code dataflows let’s break down the main elements that you interact with.
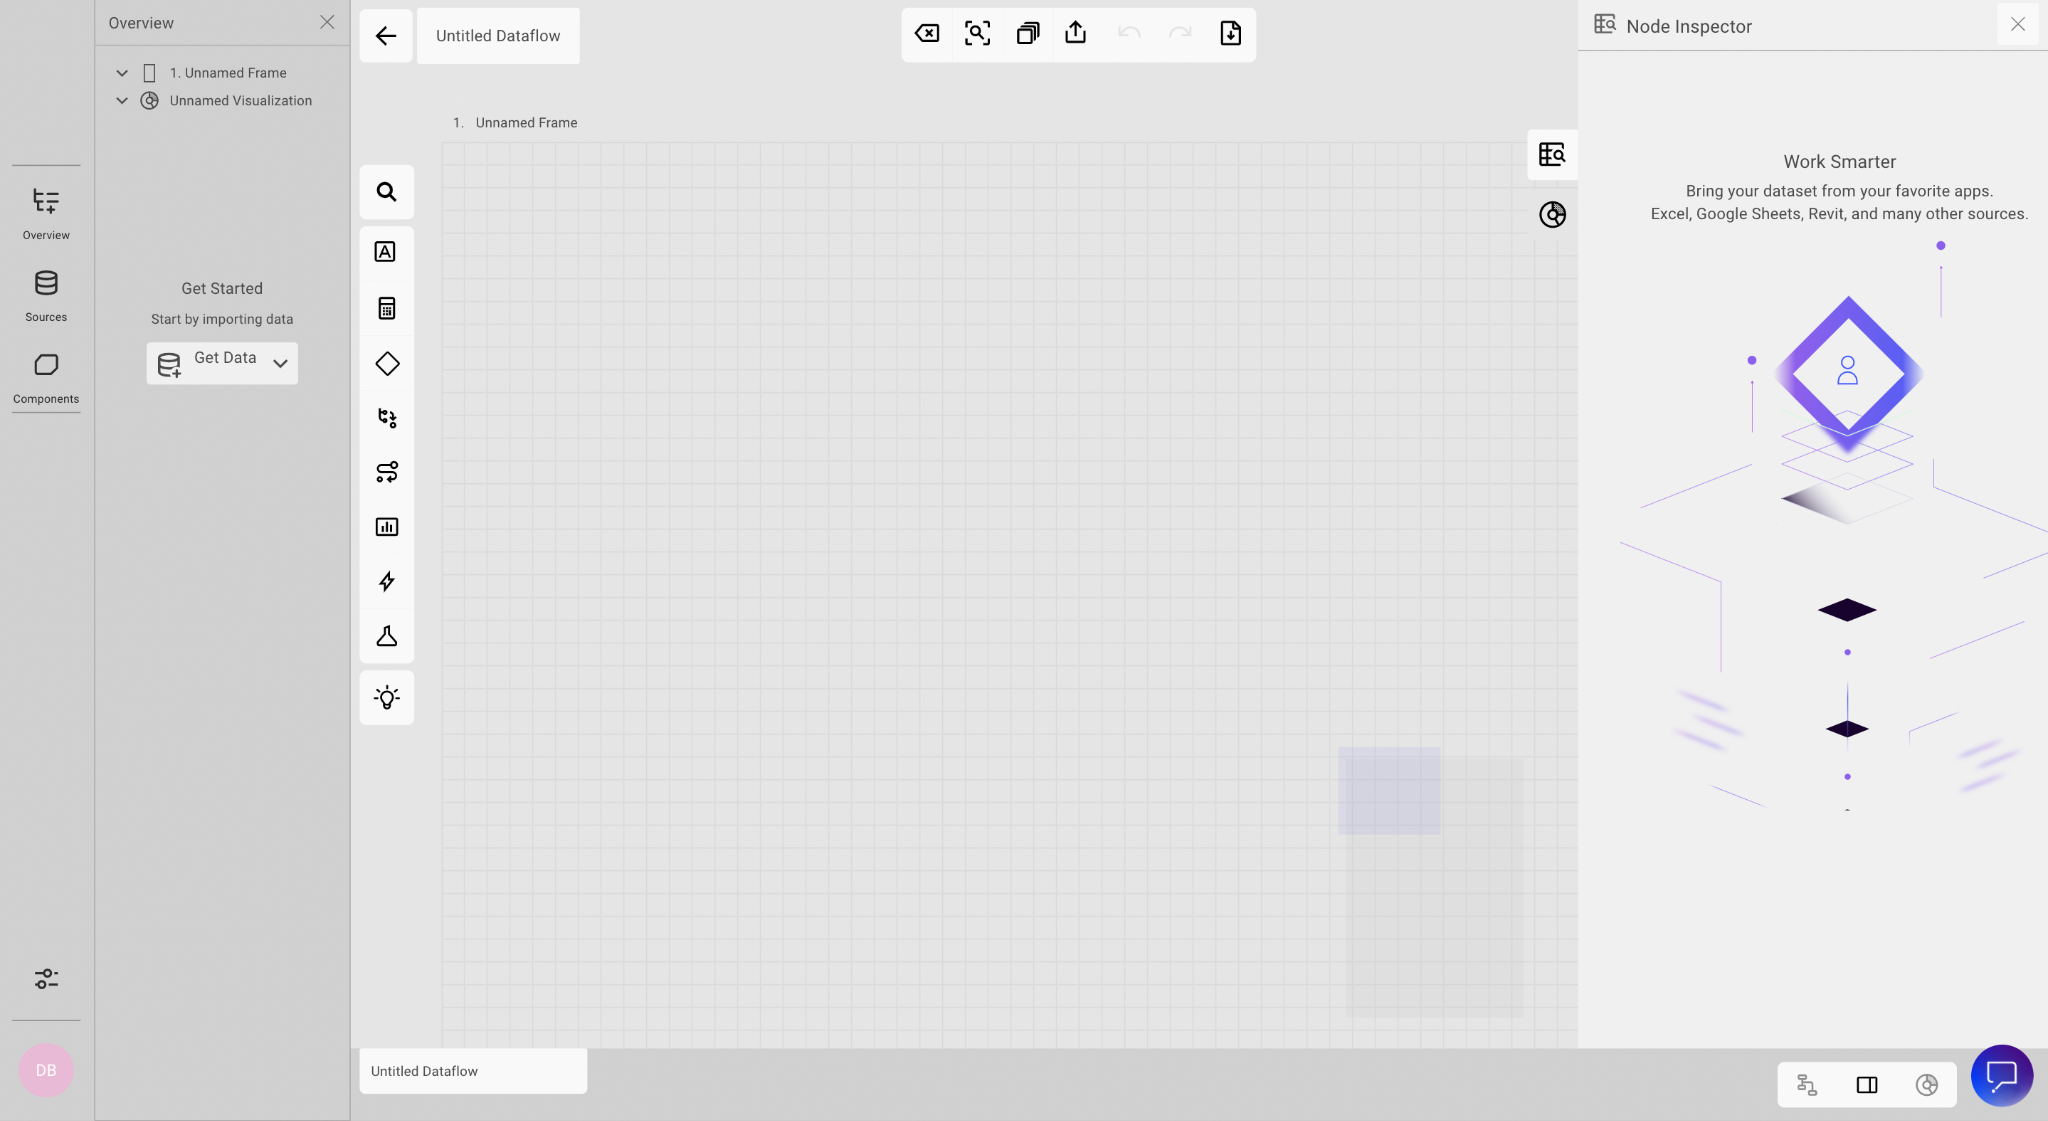
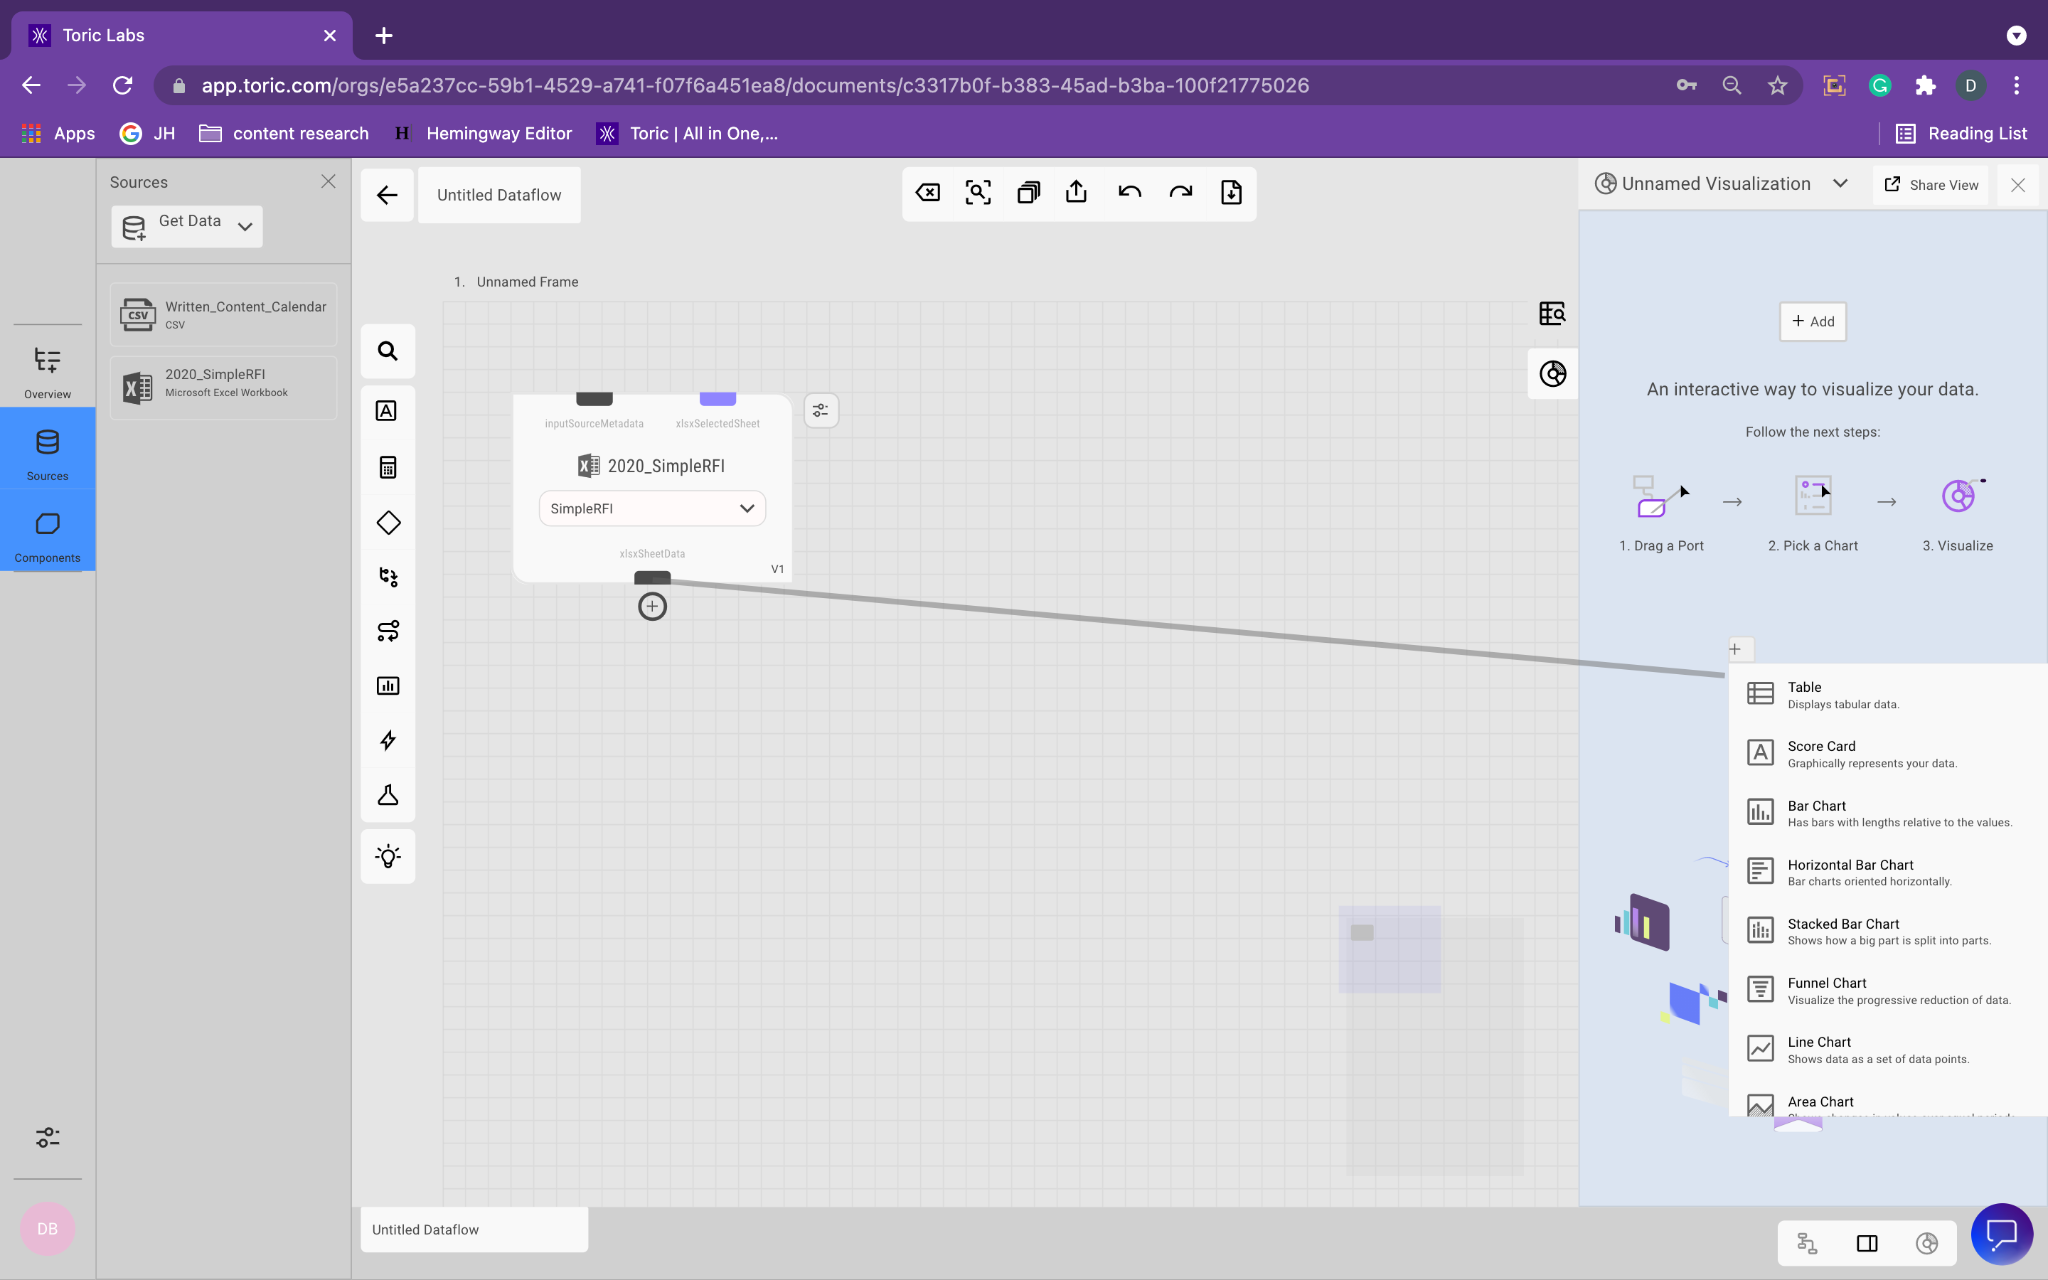
Dataflow Frame
The dataflow frame is the grid canvas you use to interact with your data whenever you create a project. This is the canvas in which you build your dataflow using nodes. But before you can interact with the data, you need to have data to interact with. There are many ways you can pull in data into a frame. Drag and drop files directly onto the frame or use the panel on the left side to connect to existing data, an integration or a plugin.
Data Sources
What kind of sources can you pull into Toric?
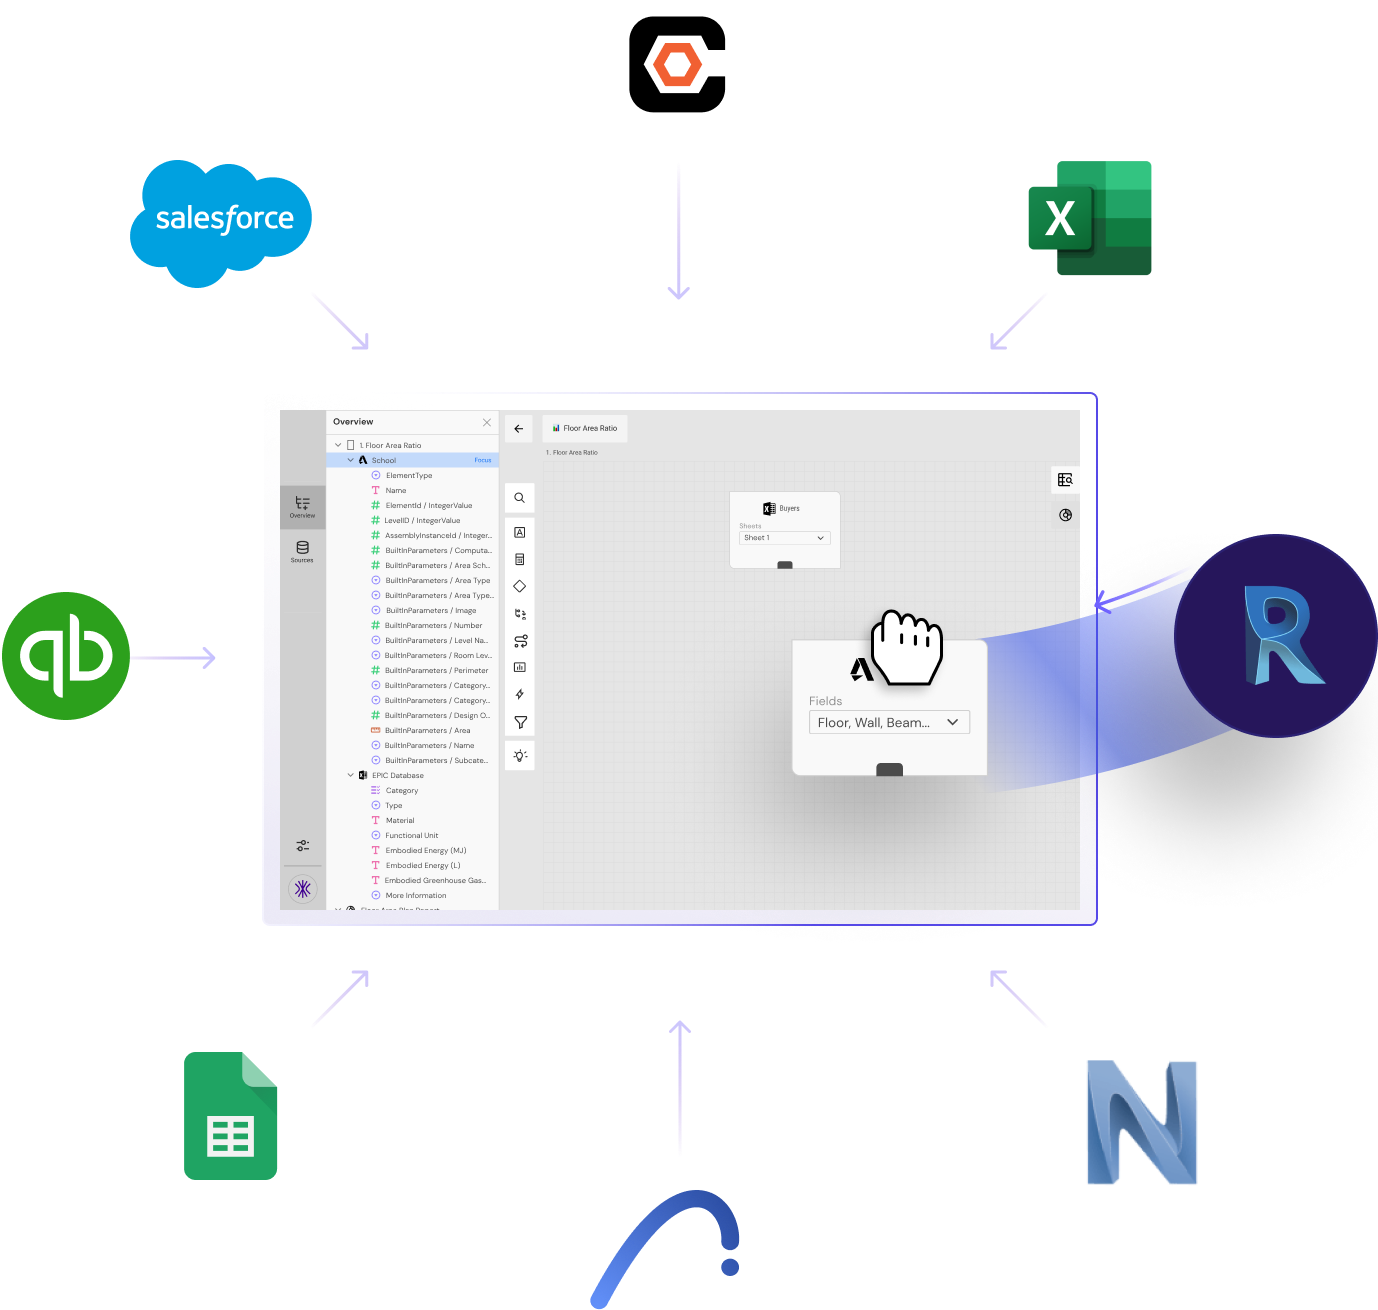
Toric enables your team to collect data from multiple sources and leverage a single pipeline for data analysis. Work with Excel Files, CAD files, BIM data, finance data, databases, and more all in one place.
Toric supports all Autodesk® Revit® model data families, Generic Models, Salesforce, Quickbooks, Revit, Excel, views and more. Each month we explore new partnerships via API and plugins to your organization’s favorite tools.
Simply drag and drop files from your computer onto the dataflow or connect to an integration and insert it onto the dataflow frame.
View All Integrations
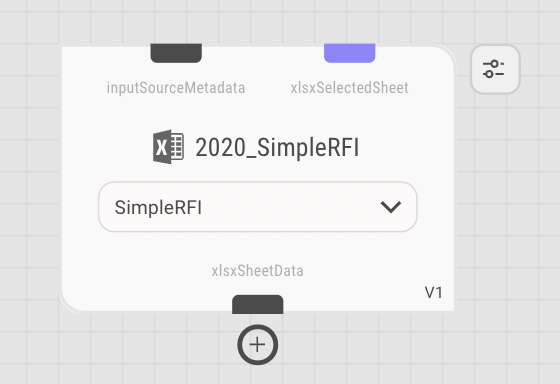
Nodes
A node is a point at which lines or pathways intersect or branch; a central or connecting point. These nodes are how you interact with your data. A node could be a data source, a transformation, a visualization, an equation, and more. These nodes enable you to connect data and break down your dataflow.
Want to learn more about nodes? Jump into a template or check out our support: Working with nodes.

Node functions - Categories & Transformation Types
You use these nodes to interact with your data by building connections between your data, transforming your data, and more. Let’s walk through some of the functions of nodes. Our team is always finding helpful ways of interacting with the data in the dataflows- dive into the app to see the latest transformation types.
Types of Nodes - Check out our Node Glossary for a full list of nodes
Node Inspector
Inspect the data source within a node using the node inspector. This node inspector is available in the right panel.

Data Apps
These data apps are the end result of your data exploration - they are the reports and dashboards you create as you navigate your data.
Once you have finished creating a report, you can turn it into a reusable template, meaning you can create your own reusable data apps to populate a library your team can use.
Start with a Pre-Built App
Now that you understand the basics of a dataflow and data app you are ready to dive in and start using Toric. Visit our data app library to find a use case to start with or build your own data app from scratch.
.png)


.png)


